
Vibration Time History Testing
Vibration time history data, measured in various field environments, has been available for many years. The challenge facing test engineers has always been how to replicate these measured environments in the lab on a vibration test shaker system.
History
Most existing vibration test procedures use some form of approximation in an attempt to transform the measured environment into a standardized test specification.
Sine
Early in the vibration test industry only sine controllers were available to drive shakers, resulting in pure sinusoidal motion applied over a set of stepped frequency intervals or as a frequency sweep. Although sine vibration continues to be a useful tool for identifying mechanical resonances and for conducting fatigue tests, it is not adequate in reproducing actual field data.
Random
As shaker controllers became more sophisticated, random vibration entered the picture. All frequency components over a given bandwidth could be generated simultaneously with randomly varying vibration amplitude (g) at each frequency. A white noise source was used to drive the shaker system rather than a sine oscillator. Unlike sine testing, random vibration excited all test specimen resonances in the applied spectrum simultaneously, significantly advancing the art of testing in terms of "realism" compared to sine testing.
As a result, many military test specifications were changed from sine to random vibration, reflecting the complex broadband vibration known to exist in the various service environments for aircraft, ships, missiles, etc. Many commercial test procedures (ASTM, IEC, etc) soon followed, specifying random vibration, especially in the area of transportation environments. The subsequent introduction of digital controllers extended even further the test engineer’s ability to shape and control random vibration tests in the lab.
Yet even after these major advances in vibration testing methods, a key limiting factor remained. The vibration test specifications were still based on an approximation of the actual field data.
Spectrum Analysis
Vibration measurements from a spectrum analyzer are often used to formulate the shape of the random test spectrum for a general class of hardware such as aircraft engine accessories, automobile fuel injection systems, suspension system hardware and the like. The key factor in this form of measurement is the way in which the vibration spectrum is actually calculated. In order to achieve a valid spectrum analysis of such vibration sources, many instantaneous signal measurements (samples) made over time must be combined using some kind of spectrum averaging method to produce a statistical approximation of the vibration spectrum (power spectral density PSD measurement).
As an inherent part of the spectrum measurement process itself, infrequently occurring vibration events are "discounted" in terms of their contribution to the overall measured spectrum. Discounting of potentially important but infrequently occurring vibration events is an unavoidable part of the spectrum analysis method. This measurement limitation must be recognized as a fundamental barrier that detracts from our ability to bring uncompromised acceleration time history data from the field to the vibration test lab.
Ideally, using the actual service environment as the test program would provide better correlation with a product’s service behavior and design limitations, as well as, failures expected as a result of transportation or operation in the field. It also seems reasonable that screening programs can benefit from this type of “REAL” testing, because of the inclusion of what might be significant transient phenomena. Certainly more investigation is warranted as far as establishing an appropriate screening time history.
What are the inherent differences between actual time histories and a spectrum analysis approximation? The following test case provides some clarification.
Where are the Washboard and Potholes?
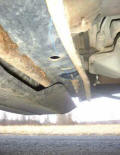
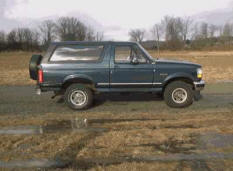 As a test case, a 1995 Ford Bronco was instrumented with four Kistler Type 8728A500 accelerometers in locations described in Table 1. The vehicle was driven at a constant velocity over a 100-yard test track (see Figure 1) simulating various road conditions such as gravel, washboard, and potholes.
Actual vibration from the four locations on the vehicle was recorded using an Unholtz-Dickie portable acquisition and vibration control system (PACS). Two types of measurements were recorded:
- Avg. acceleration spectrum vs. frequency – Power Spectral Density (PSD) using Analyze software (Random test type)
- Actual peak acceleration vs. time – Acceleration time history using DATAcq software
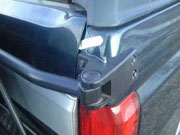
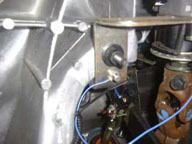
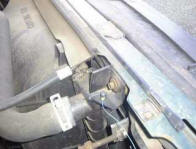
Accelerometer Placement
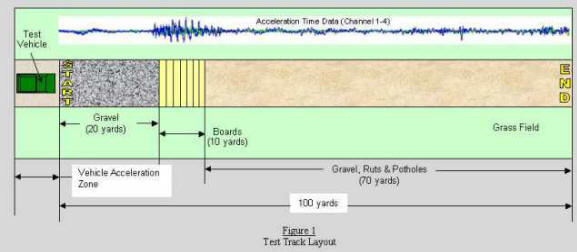
Test Track
The 100 yard test track includes a 20 yard gravel segment, 10 yard washboard segment and 70 yards of unimproved road surface including ruts, various gravel size and potholes. The vehicle was driven over the track at approximately 10 and 15 MPH. Data was recorded from the start of the gravel segment to the end of the unimproved segment.
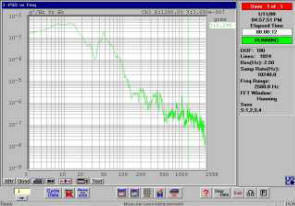
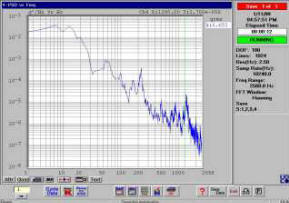
 According to the PSD (Random type) measurement at 15 MPH, the test drive, though bumpy, measured from 0.142 to 0.653 g rms depending upon the location in the vehicle (see Table 2). These data indicate the overall acceleration spectrum measured during one run on the test track. Many such measurements would usually be taken to establish a test spectrum envelope of amplitude vs. frequency for a given product in a particular location on the vehicle.
This spectrum would approximate the actual field vibration, though, in real life, the actual vibration history would include transients with much different vibration spectra. The PSD measurement is an average of instantaneous spectrum levels over the recording time interval.
Measurement Data
PSD Measurement (Random Data)
The actual time acceleration history of the same run at the same speed proved significantly different from what may be expected from the PSD measurement above. According to the actual Peak Acceleration vs. Time measurement (see Table 3), what seemed to be a rather mild ride, was actually riddled with various acceleration transients with peak values of more than 4-5 g. Most of the acceleration time history shows a rather low level acceleration which supports the "mild ride" concept implied by the PSD data in Table 2.
However, the distinct transients produced by the washboard segment and potholes are preserved as part of the true time history measurement (See Table 3). This combined, overall low level vibration with large transients, is likely to yield significant differences in a particular product response.
If your job assignment is to develop a new product or discover the cause of customer complaints or failures that have suddenly increased following a recent redesign, would you prefer to start with the acceleration power spectral density (PSD) data shown in Table 2 or the actual acceleration time history data shown in Table 3? Can you find the washboard or potholes?
DATAcq Digitized Time Data
Channel 1: Right Rear Spare Tire Support
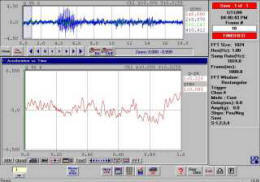
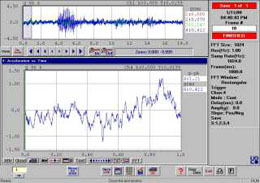
The top graph depicts the total recorded acceleration time history (18 sec). All four input channels are displayed in parallel. The time history correlates with the actual road conditions of the track in Figure 1. Notice the washboard segment and various potholes.
The bottom graph shows the detailed time history of the one-second ZOOM window for Channel 1.
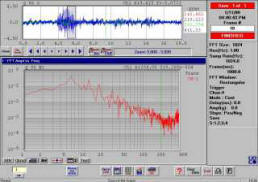
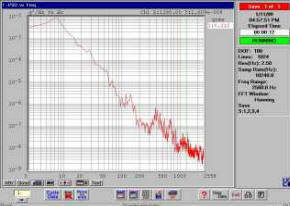
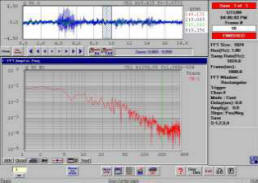
The top graph depicts the same total time history as shown previously. The bottom graph shows the FFT of the Zoom window for Channel 1 at the conclusion of the washboard segment. Notice the peaks at 6 Hz and its harmonics.
These correlate to the washboard spacing of approximately 36 inches. Compare the difference in the FFT with the graph below.
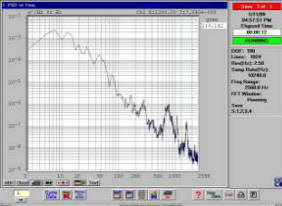
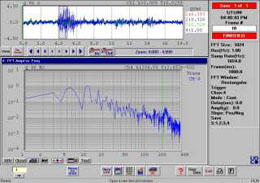
The top graph again depicts the total time history as shown previously.
The bottom graph shows the FFT of the Zoom window for Channel 1 during a section of the unimproved road segment. Compare the difference in the FFT with the graph above.
Channel 2, Steering Column Support
Channel 3, Right Top Radiator Support
Channel 4, Transfer Case Support
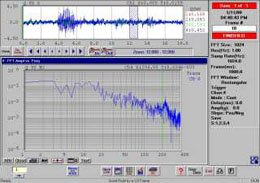
The top graph depicts the same total time history as shown previously. Channel 4 provided the highest acceleration levels of the four input channels.
The bottom graph shows the FFT of the Zoom window for Channel 4 at the start of the washboard segment. Like Channel 1, notice the peaks at 6 Hz and its harmonics. These correlate to the washboard spacing of approximately 36 inches. Compare the difference in the FFT with the graph below.
The top graph again depicts the total time history as shown previously.
The bottom graph shows the FFT of the Zoom window for Channel 4 during a section of the unimproved road segment. Again, notice the difference in the FFT compared to the graph above. The FFT is constantly changing with time.
Repeat the Test Drive in the Lab!
Knowing what the actual service environment is for a specific product is an important element in the design process. Whether this data is used to improve a design or develop a new design does not diminish the importance of knowing what vibration the product is exposed to in actual field service. But measuring the service environment is only half of the solution.
The complete solution involves using the actual field data to develop complete test specifications for the product in the lab, whether this means scaling or modifying the data for accelerated life testing, product qualification, proof of design, design conformance, etc. In order to reduce design costs and minimize the amount of actual field testing, effective implementation of the service environment must be accomplished in the lab. The significance of using actual field data is obvious and has been used for a number of years by the major automobile manufacturers to test the entire vehicle utilizing an elaborate multi-million dollar test equipment configuration. The capability to easily use field data in the lab as a test reference for individual product or subassembly testing on an appropriately sized shaker system is a technology that has only recently been realized at a much more affordable price.
This technology will certainly take us away from statistical approximations exemplified in Table 2 to utilization of actual acceleration time histories as exemplified in Table 3. Just as the washboards and potholes are important to the vehicle or component’s response in the field, so too are these important to the development of test specifications for the lab.
The acceleration time history shown in Table 3 is data acquired using a recently introduced software module called “DATAcq” that provides for real time data acquisition of acceleration time history at various selected sample rates. The resulting time history display looks essentially like a digitized strip chart record of the acceleration signal. This DATAcq data can be converted easily to a reference waveform and then used to replicate the actual acceleration time history on a shaker using closed-loop control with another recently introduced software application called TRAC (Time Replication Acceleration Control).
DATAcq and TRAC were developed by Unholtz-Dickie Corporation to provide the capability to measure actual acceleration time history in the field and to import this data as a time domain reference for closed loop control in the laboratory. TRAC supports both DATAcq data and ASCII file data for the acceleration time history reference making it easy to import most acquired data from various data acquisition systems.
Testing in the Lab - Data
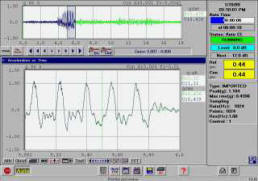
Figure 2A
Recreation of test track "washboard" segment acceleration time history on an actual shaker system during TRAC test (blue = control time history, green = reference time history). Zoom Section (5-6 sec) shown in bottom graph.
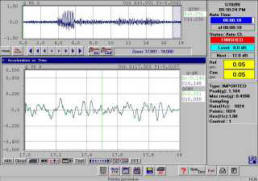
Figure 2B
Complete acceleration time history reproduction of test track on an actual shaker system using TRAC. Zoom section (17-18 sec) shown in bottom graph.
Figure 2A shows the reproduction of the actual vibration time history collected from the Ford Bronco spare tire support on an actual shaker using TRAC. Figure 2A shows the recreation of the actual acceleration time history of the washboard segment recorded in the early portion of the test run. Figure 2B shows the complete time history reproduction. The final reference waveform was high pass filtered at 5 Hz using the TRAC waveform editor in order to decrease the displacement requirements to match the shaker stroke limits. The PACS control system equalized and controlled the test to within specified tolerances and aborts. The actual acceleration time history is reproduced at the location of the control accelerometer usually located on the test fixture or at the specimen/fixture interface. The acceleration time history at this point matches the actual field data.
Though this application has been simplified, the significance of using actual acceleration time history is obvious. Actual vibration recorded from anywhere on a vehicle or other product (automobiles, planes, trains, trucks, military vehicles, marine vehicles, missiles, satellites, etc.) can be used with the appropriate size shaker systems to reproduce the actual service vibration histories in the lab. A powerful data editor, provided with TRAC, allows for scaling of the time history data, low and high pass filtering, appending other waveforms, re-sampling, and deleting portions (i.e. idle periods) of the waveform. These editing features in conjunction with looping and cycling portions of the waveform, and sequencing multiple waveforms, are used in support of test development for reliability testing, product qualification, proof of design testing, fragility testing, and production screening.
Product Development - Vibration Test Lab
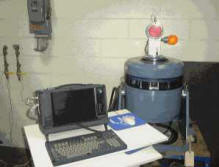 PACS Controller pictured with S062 Shaker and Tail Light Assembly
Let us assume that a particular supplier of tail lights and turn signals is developing a new product for the automotive industry. The design must be vibration tested to prove its reliability in the field. The supplier knows from past experience that the service environment can be severe depending upon the manufacturer of the vehicle as well as where the product is installed on the vehicle.
This knowledge puts in question the use of standardized tests used previously in the development phase. Growing competitiveness in the market place has put greater demands on the design team to produce a reliable product rapidly. Unfortunately, the actual service environment is unknown.
Fortunately this supplier has a data acquisition system capable of measuring acceleration versus time and also access to acceleration time history data from its customers (ASCII data). These data along with TRAC technology can be used to reproduce the actual acceleration time histories in the lab.
In a short time the tail light and turn signal supplier can be testing its new products with actual acceleration test references that closely match the actual service environment. The product can be qualified before it ever reaches the field. Figure 3 shows a vibration test system used to test new generation lights in the lab. Shown is the portable PACS Controller, an electrodynamic shaker system, fixturing and product.
Imagine that you’re standing beside the shaker in Figure 3 with your hand resting on the vibration fixture during the actual TRAC test.
- Can you feel the low g vibration spectrum from the gravel segment?
- How about the occasional 4-5 g transient shocks from the washboard?
- Feel any potholes?
- Are they there?
The answer is Yes!
Testing is certainly not limited to small products or subassemblies, but limited only by the performance envelope of the specific shaker system. The tremendous variety of shaker systems on the market provide the capability to test very small to very large test items over a wide range of acceleration time history waveforms.
Summary
Advanced methods of data acquisition and shaker control are now available to permit time history vibration testing to be performed in the lab, based on actual field data rather than on approximations which may eliminate important acceleration events. Conventional testing methods (random, sine, shock) are common and have proven their usefulness in product development and production screening. However, with improved vibration control technology come other options like TRAC. TRAC changes the way we think about testing because it matches the actual field environment. TRAC is essentially a combination of random, sine and shock and is yet another tool in the quest for creating the perfect test solution bridging the gap between the lab and the actual service environment.
DATAcq and TRAC are exclusive software applications offered by Unholtz-Dickie Corporation for the APEX SL and VwinII Windows-based vibration control systems. Please contact UD for further information.